
Weather Graphs
Our graphs
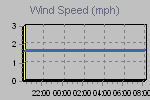
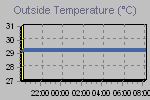
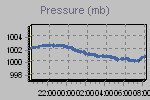
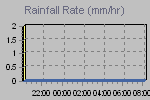
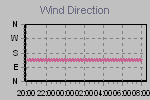
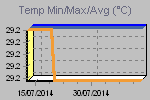
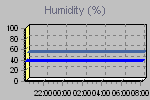
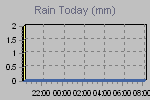
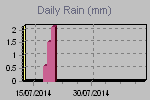
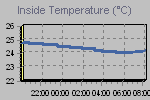
These graphs present temperature, pressure, rainfall, and wind speed trends for the last 12 hours.
The thumbnail graphs are sampled every ten minutes. Click on a thumbnail to display the corresponding larger graph in the panel above it. The large graphs are sampled every minute.
Click on a thumbnail to show a large graph in the panel below.
Update : 13/08/2014 08:15:01
By Cumulus v1.9.2 (1032)
 |
 |
 |
 |
 |
 |
 |
 |
 |
 |
|
